Application monitoring software is an essential tool for businesses of all sizes. It provides insight into application performance, user behaviour, and system availability, allowing you to identify and address any potential issues quickly.
With the right application monitoring solution, you can maximize uptime and performance to ensure your customers experience the best possible user experience.
Various application monitoring solutions are available on the market, but it is crucial to select one that fits your specific needs. When selecting a solution, consider factors like scalability, compatibility, and cost. With the right application monitoring software, you can ensure that your business is running as efficiently and effectively as possible.
What is Application Performance Monitoring (APM)?
Application Performance Monitoring (APM) refers to the practice of monitoring and analyzing the performance and availability of software applications. It involves using specialized tools and techniques to gather data about various aspects of an application’s performance, such as response times, resource utilization, error rates, and user experience.
APM aims to provide insights into the performance of applications in real-time or near real-time, helping organizations identify and address performance issues and bottlenecks. By monitoring applications proactively, APM enables timely detection of performance problems, allows quicker troubleshooting and resolution, and helps maintain optimal application performance.
Key Components And Features of An Application Monitoring Software /APM Tools Solution May Include:
Performance Monitoring:
APM tools monitor application response times, transaction times, and resource utilization to assess overall performance. They provide visibility into both server-side and client-side performance metrics.
Error and Exception Tracking:
APM captures and logs errors, exceptions, and crashes occurring within an application. It helps identify the root causes of errors and facilitates debugging.
Transaction Tracing:
APM allows for tracing individual transactions as they move through various components and layers of an application. This helps identify bottlenecks and performance issues at a granular level.
Real-time Alerting:
APM systems can generate alerts and notifications based on predefined thresholds or abnormal behaviour, enabling IT teams to respond quickly to issues and minimize downtime.
Diagnostics and Troubleshooting:
APM tools provide diagnostic capabilities, including detailed performance data, code-level insights, and visibility into dependencies, allowing for efficient troubleshooting and issue resolution.
End-User Monitoring:
APM solutions often include features to monitor the user experience, such as page load times, transaction success rates, and user behaviour analysis. This helps identify performance issues from the end-user perspective.
Scalability and Load Testing:
APM tools can simulate and monitor application performance under different loads and stress conditions, helping organizations assess scalability and identify potential performance bottlenecks.
Analytics and Reporting:
APM solutions offer analytics and reporting capabilities to visualize performance data, identify trends, and generate reports on application performance, usage patterns, and key performance indicators.
By implementing APM practices and leveraging APM tools, organizations can gain valuable insights into their application’s performance, detect and resolve issues more efficiently, optimize resource utilization, enhance user experience, and ensure their software applications’ overall reliability and availability.
Benefits of Application Monitoring Software/ APM Tools:
Application Performance Monitoring (APM) software provides several benefits to organizations that rely on software applications. Here are some key advantages of implementing APM software:
Proactive Issue Detection:
APM software continuously monitors applications in real-time, allowing for the early detection of performance issues and bottlenecks. It provides alerts and notifications when performance metrics deviate from predefined thresholds, enabling IT teams to proactively address issues before they impact end users.
Improved Application Performance:
APM tools provide deep insights into application performance, including response times, transaction times, and resource utilization. With this information, organizations can identify and optimize performance bottlenecks, leading to faster and more reliable application performance.
Enhanced User Experience:
APM software helps organizations monitor and analyze the end-user experience. By measuring metrics such as page load times, transaction success rates, and user behaviour, it enables organizations to identify areas for improvement and optimize the user experience, resulting in increased user satisfaction.
Efficient Troubleshooting and Issue Resolution:
APM tools offer diagnostics and troubleshooting capabilities, allowing IT teams to quickly identify the root causes of performance issues. With code-level insights, error tracking, and transaction tracing, APM software streamlines the troubleshooting process, reducing mean time to resolution (MTTR) and minimizing the impact on end-users.
Optimal Resource Utilization:
APM software provides visibility into resource utilization, including CPU, memory, and network usage. Organizations can optimize resource allocation, improve scalability, and avoid overprovisioning by identifying resource-intensive components or processes, leading to cost savings and improved application performance.
Scalability Assessment:
APM tools often include load testing capabilities, allowing organizations to simulate and monitor application performance under different loads and stress conditions. This helps assess the scalability of applications, identify performance bottlenecks, and plan for future capacity needs.
Data-Driven Decision-Making:
APM software provides comprehensive analytics and reporting, offering actionable insights into application performance trends, usage patterns, and key performance indicators (KPIs). This data empowers organizations to make informed decisions, prioritize optimizations, and align application performance with business objectives.
Cost Savings:
By optimizing application performance, APM software helps organizations reduce operational costs associated with inefficient resource usage, extended troubleshooting efforts, and performance-related downtime. It also supports capacity planning, enabling organizations to allocate resources effectively and avoid unnecessary infrastructure investments.
Enhanced Customer Satisfaction and Retention:
Reliable application performance and an improved user experience contribute to increased customer satisfaction. APM software helps organizations deliver applications that meet user expectations, resulting in improved customer loyalty and retention.
These benefits ultimately lead to increased operational efficiency, cost savings, and enhanced customer satisfaction.
List Of Best Application Monitoring Software /APM Tools
DataDog:
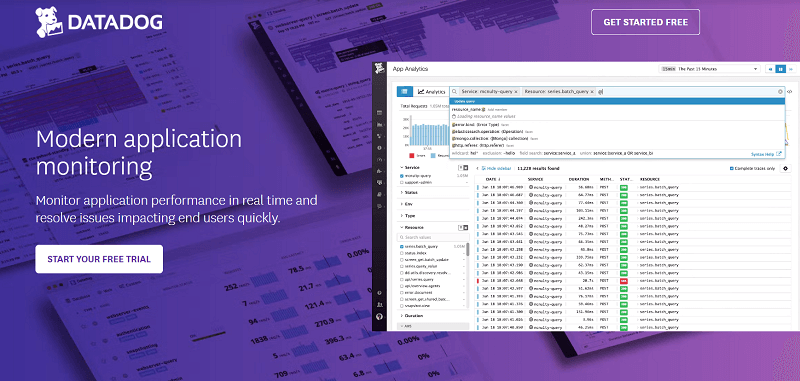
Datadog is a comprehensive application monitoring software that provides organizations with powerful tools to monitor and optimize the performance of their applications. With a focus on real-time visibility and actionable insights, Datadog helps businesses ensure their applications deliver a seamless user experience. Its application monitoring capabilities enable tracking of application performance metrics, including response times, error rates, and throughput. It provides deep visibility into the performance of distributed applications, helping identify performance bottlenecks and optimizing resource utilization.
DataDog Key Features:
- Get full visibility into modern applications
- Analyze and explore log data in the context
- Proactively monitor your user experience
- Correlate frontend performance with business impact
- Visualize traffic flow in cloud-native environments
- Build real-time interactive dashboards
- Share what you saw, write what you did
- Get alerted on critical issues
- Instrument your apps, write new integrations
Site 24*7:
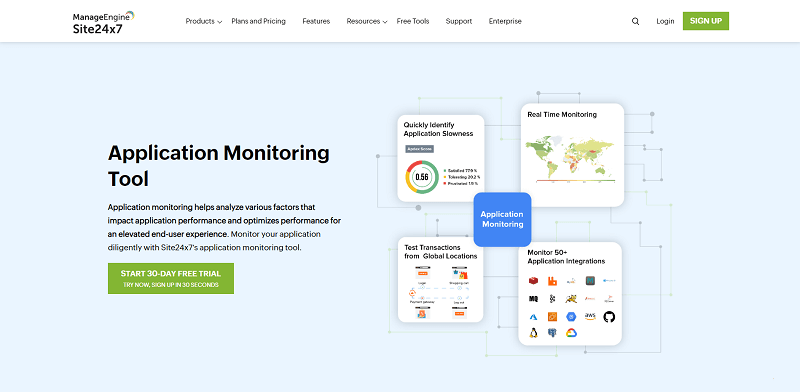
Site24x7 is a robust application monitoring software that helps businesses ensure the reliable performance of their applications. It offers comprehensive monitoring capabilities to track key performance metrics, including response times, availability, and user experience. With real-time insights and proactive alerting, Site24x7 enables businesses to identify and resolve issues before they impact end-users.
The software supports the monitoring of web applications, servers, databases, and APIs, providing a holistic view of application performance. It also offers synthetic monitoring, allowing organizations to simulate user interactions and test application performance from different locations. With its user-friendly interface and rich feature set, Site24x7 helps businesses maintain optimal application performance and deliver superior user experiences.
Site 24*7 Key Features:
- Leverage distributed tracing and improve user experience
- Visualize application topology to understand external dependencies
- Monitor custom components and capture golden metrics
- Detect anomalies and troubleshoot errors quickly with AI-powered alerts and reports
- Gain a 360° view of your application
AppDynamics:
AppDynamics is a powerful application monitoring software that helps businesses gain deep insights into the performance and health of their applications. It offers real-time visibility into critical metrics such as response times, error rates, and user experience. With code-level diagnostics and transaction tracing, AppDynamics enables organizations to identify and resolve performance issues quickly.
It provides end-to-end performance visibility across various components and layers of an application, helping businesses optimize performance and deliver exceptional user experiences. AppDynamics offers features such as business transaction monitoring, application analytics, and server and infrastructure monitoring. With its comprehensive monitoring capabilities and advanced analytics, AppDynamics empowers businesses to proactively manage application performance and ensure seamless operations.
AppDynamics Key Features:
- Business transaction monitoring
- Code-level diagnostics
- Server and infrastructure monitoring
- End-to-end performance visibility
- Application analytics
Dynatrace:
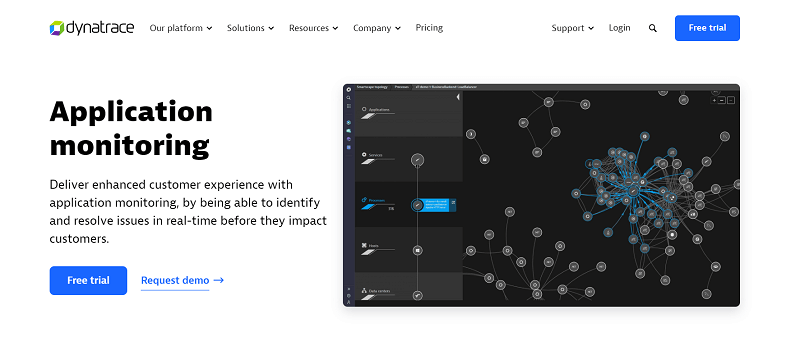
Dynatrace is a leading application monitoring software that provides organizations with powerful tools to monitor and optimize the performance of their applications. It offers real-time, AI-powered monitoring capabilities to gain deep insights into application performance, user experience, and infrastructure. With its automatic root cause analysis and distributed tracing, Dynatrace helps identify performance bottlenecks and optimize resource utilization.
It offers end-to-end transaction tracing, enabling organizations to track application requests across various components and layers. Dynatrace also provides cloud-native support, ensuring seamless monitoring of applications in cloud environments. With its comprehensive monitoring features and advanced analytics, Dynatrace empowers organizations to proactively manage application performance, enhance user experiences, and drive business success.
Dynatrace Key Features:
- Real-time monitoring and analytics
- Automatic root cause analysis
- End-to-end transaction tracing
- User experience monitoring
- Cloud-native support
SolarWind Server & Application Monitor Software:
SolarWinds Server & Application Monitor is a robust software solution designed to monitor the performance and health of servers, applications, and infrastructure. It provides comprehensive visibility into critical metrics such as CPU usage, memory utilization, response times, and application availability. With its intuitive dashboard and customizable alerts, SolarWinds Server & Application Monitor enables organizations to quickly identify and resolve issues impacting performance.
It supports monitoring of both physical and virtual servers, as well as a wide range of applications and services. Additionally, the software offers in-depth performance analytics, automated network discovery, and out-of-the-box templates for popular applications. With SolarWinds Server & Application Monitor, organizations can ensure the optimal performance and availability of their server and application infrastructure.
SolarWind Server & Application Monitor Key Features:
- SolarWind Server & Application Monitor Key Features:
- Start typically within minutes
- Monitor Azure and AWS IaaS, PaaS, and SaaS
- 1,200+ pre-built monitoring templates, plus more than 1,000 community templates
- REST API, WMI, SNMP, and PowerShell scripts for customized monitoring
- Customizable server monitoring
- Infrastructure dependency mapping
Instana (By IBM):
Instana is an advanced application monitoring software designed to provide real-time insights into the performance and health of modern microservices and containerized applications. It offers automatic and continuous monitoring capabilities, eliminating the need for manual configuration. With its AI-powered observability, Instana automatically detects and maps application components traces requests across distributed environments, and analyses performance metrics.
It provides code-level visibility, identifying hotspots and bottlenecks in real-time. Instana also offers end-user monitoring, infrastructure monitoring, and automated root cause analysis. With its comprehensive monitoring and analysis capabilities, Instana helps organizations proactively manage application performance, optimize resources, and deliver exceptional user experiences in dynamic and complex application environments.
Instana Key Features:
- Accurate Monitoring
- Dynamic Graph records
- Analyze all data in real-time
- Eliminate The Noise of Symptomatic Events
- Dependency Map to automatically visualize every dependency with context.
- Get immediate, automated feedback on every new release, deployment, and version
Splunk APM:
Splunk APM (Application Performance Monitoring) is a robust software solution that provides organizations with comprehensive visibility into the performance and health of their applications. It offers real-time monitoring and analysis of application performance, infrastructure, and user experience. Splunk APM collects and correlates data from various sources, including logs, metrics, and traces, to provide a holistic view of application performance.
It utilizes machine learning and predictive analytics to identify performance anomalies and proactively alert users. Splunk APM also offers powerful diagnostic capabilities, including code-level visibility and distributed tracing, to pinpoint and resolve performance issues quickly. With its extensive feature set and analytical capabilities, Splunk APM empowers organizations to optimize application performance, enhance user experiences, and drive business success.
Splunk APM Key Features:
- No Sample Full-fidelity trace ingestion
- Full-stack observability
- AI-Driven Directed Troubleshooting
- Infinite cardinality exploration
- Real-time streaming analytics
- Open, flexible instrumentation
- OpenTelemetry
eG Innovation:
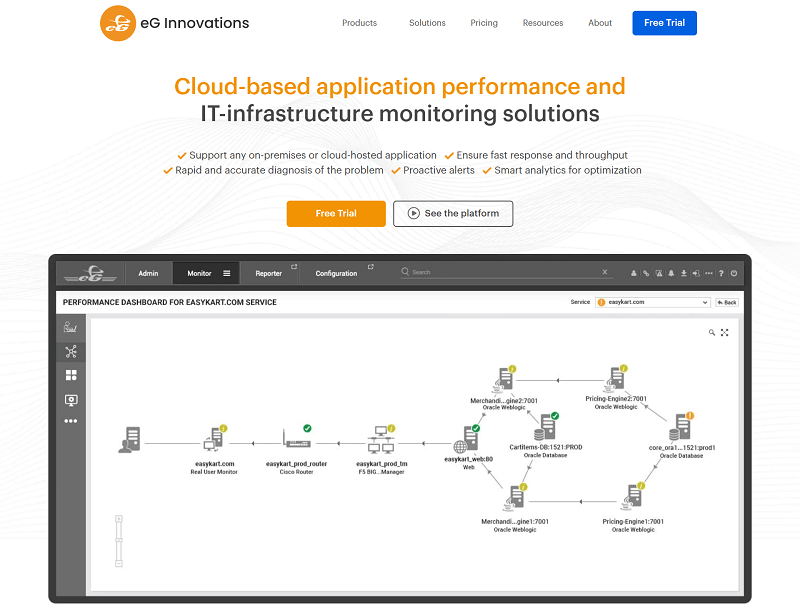
eG Innovation APM (Application Performance Monitoring) software is a comprehensive solution designed to monitor and optimize the performance of applications and IT infrastructure. It offers end-to-end visibility into the entire application stack, including servers, virtualization platforms, databases, and user experience. eG Innovation APM provides real-time monitoring, proactive alerting, and advanced analytics to identify and resolve performance issues.
It offers features such as code-level diagnostics, transaction tracing, and synthetic monitoring to gain deep insights into application performance. The software also supports the monitoring of cloud environments and provides detailed reports for capacity planning and optimization. With eG Innovation APM, organizations can ensure optimal application performance, reduce downtime, and deliver superior user experiences.
eG Innovation APM Key Features:
- 100% Web-Based Architecture
- User Experience Monitoring
- Enterprise Application Monitoring
- Configuration Change Tracking
- Intelligent Reporting for Auditing and Analysis
- Integration and Extensibility
- Multi-Tenancy and Personalized Views
- Application Code-Level Visibility
Sematext:
Sematext APM (Application Performance Monitoring) software is a powerful solution designed to monitor application performance and user experience. It provides real-time insights into application performance, user experience, and infrastructure metrics. Sematext APM offers amazing features that provide end-to-end monitoring to optimize customer satisfaction and business operations.
It supports a wide range of applications, frameworks, and platforms, allowing for comprehensive monitoring across different technologies. Sematext APM also offers anomaly detection, customizable dashboards, and alerting capabilities to proactively address performance deviations. With its intuitive interface and powerful monitoring capabilities, Sematext APM enables organizations to ensure the smooth operation of their applications and deliver exceptional user experiences.
Sematext Key Features:
- Distributed Transaction Tracing
- Real User Monitoring
- Synthetic Monitoring
- Custom Pointcuts (for JVM)
- Application Performance & Dependencies Visualization
- Full-Stack Observability
- Code-Level Visibility
New Relic:
New Relic APM (Application Performance Monitoring) software is another powerful solution designed to monitor, analyze, and optimize the performance of applications. It provides real-time visibility into critical metrics such as response times, throughput, and error rates. New Relic APM offers code-level diagnostics, transaction tracing, and performance analytics to identify and troubleshoot performance issues quickly.
It supports a wide range of programming languages, frameworks, and platforms, allowing for comprehensive monitoring across diverse environments. New Relic APM also provides synthetic monitoring and real user monitoring (RUM) to assess and optimize the user experience. With its user-friendly interface and rich feature set, New Relic APM empowers organizations to proactively manage application performance, enhance scalability, and deliver exceptional user experiences.
New Relic Key Features:
- Application Monitoring in One Place
- Build Any Dashboard with no coding involved.
- Database Monitoring to point out critical errors
- Availability & Error Monitoring.
- Reports to Measure Performance
- Integrated Collaboration Tools
- Security.
Conclusion – Best Application Monitoring Software
Choosing the right application monitoring software is crucial for businesses to ensure optimal performance, identify issues in real-time, and maintain customer satisfaction. With its advanced features and comprehensive monitoring capabilities, the best application monitoring software empowers organizations to proactively manage their applications and drive business success.